Your Sites Analytics Dashboard helps you track key metrics for your funnels, websites, and QR Codes. This will help you gain a clearer picture of your page views and conversion rates among other metrics. By understanding these insights, you can spot what’s working and what needs improvement, allowing you to make decisions to increase your online presence.
You can find the Analytics Dashboard by navigating to Sites in the left sidebar and selecting Analytics.

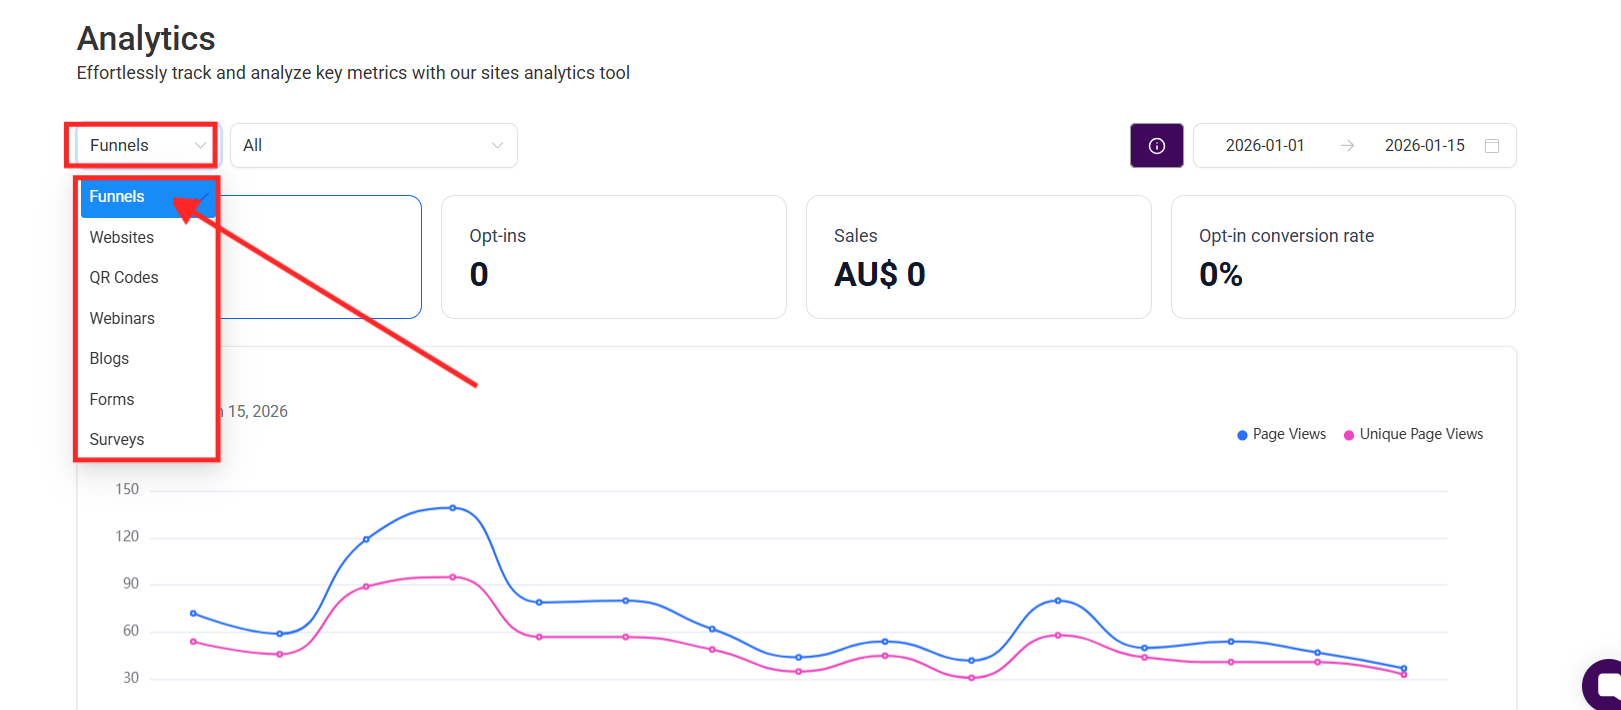
Click the Source dropdown menu to choose the data asset you wish to analyze.
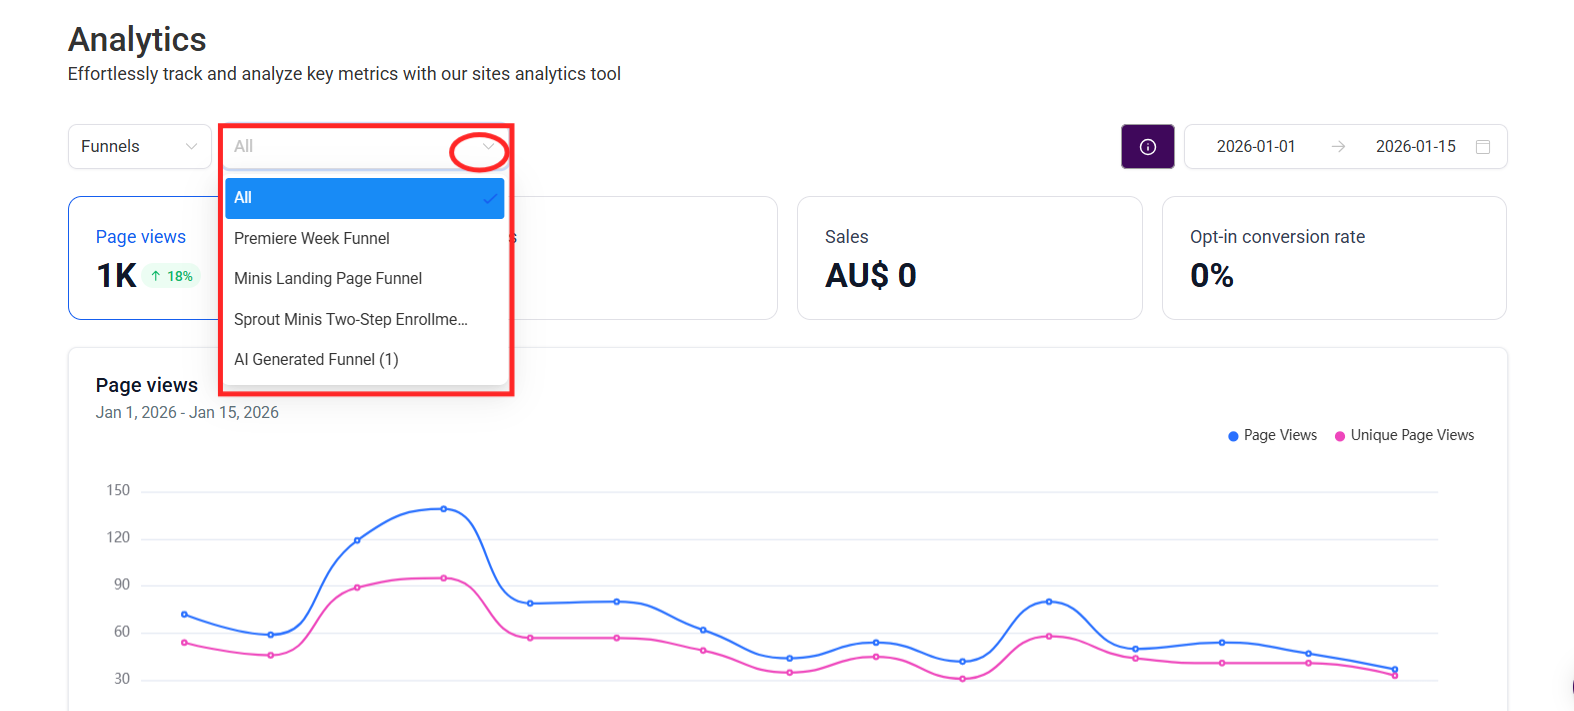
By selecting the dropdown to the right, you can view data for all of the associated pages or QR codes, or you can choose a specific asset to view.
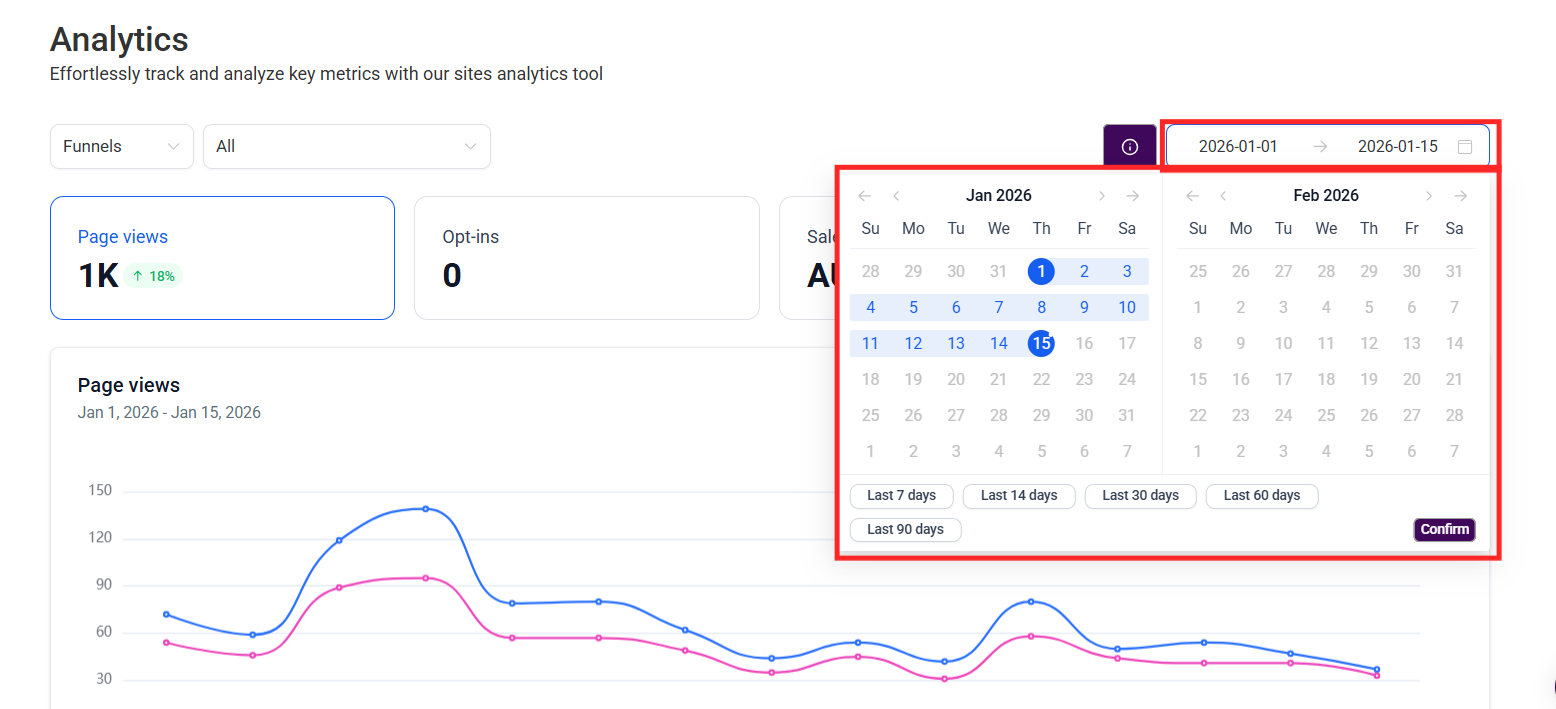
Select a date range with the date picker to view analytics within your chosen time frame.
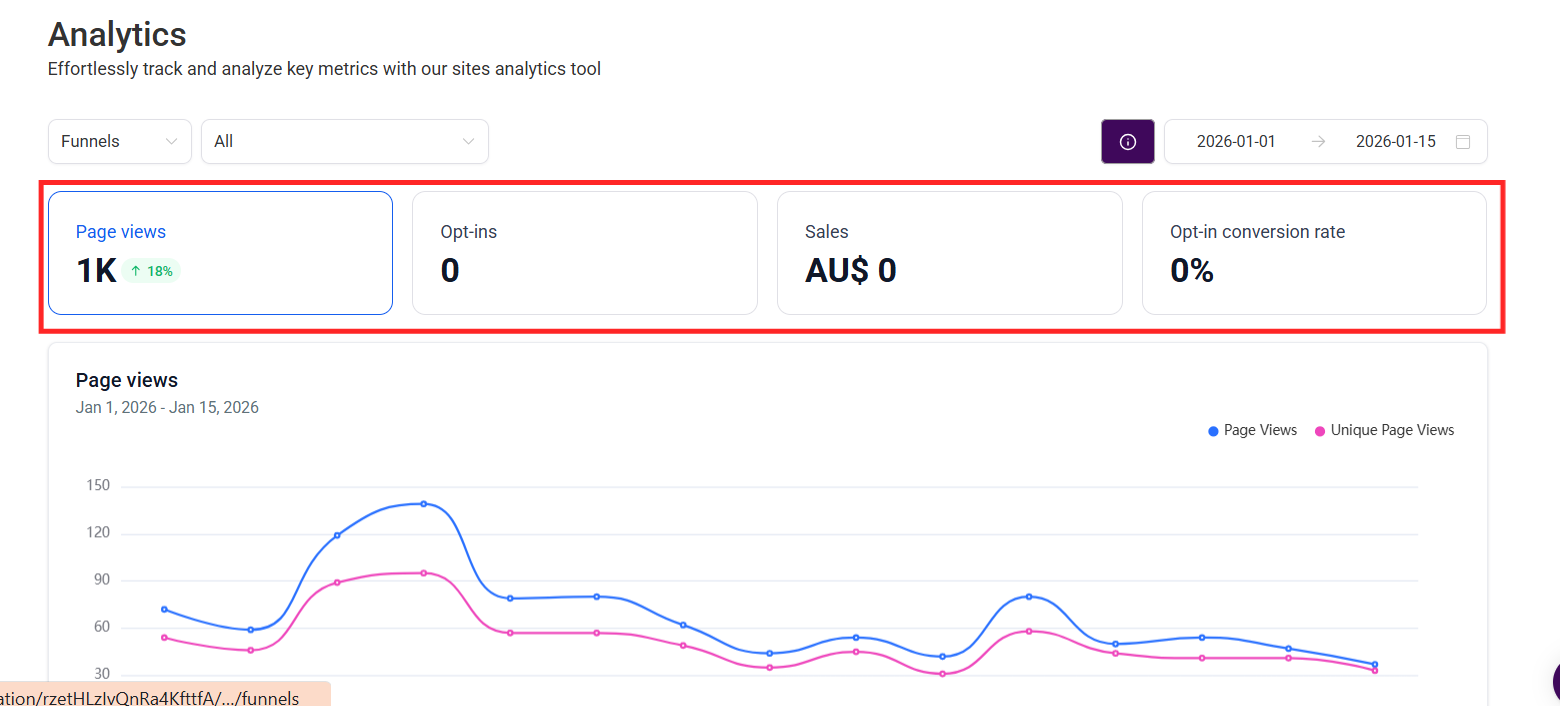
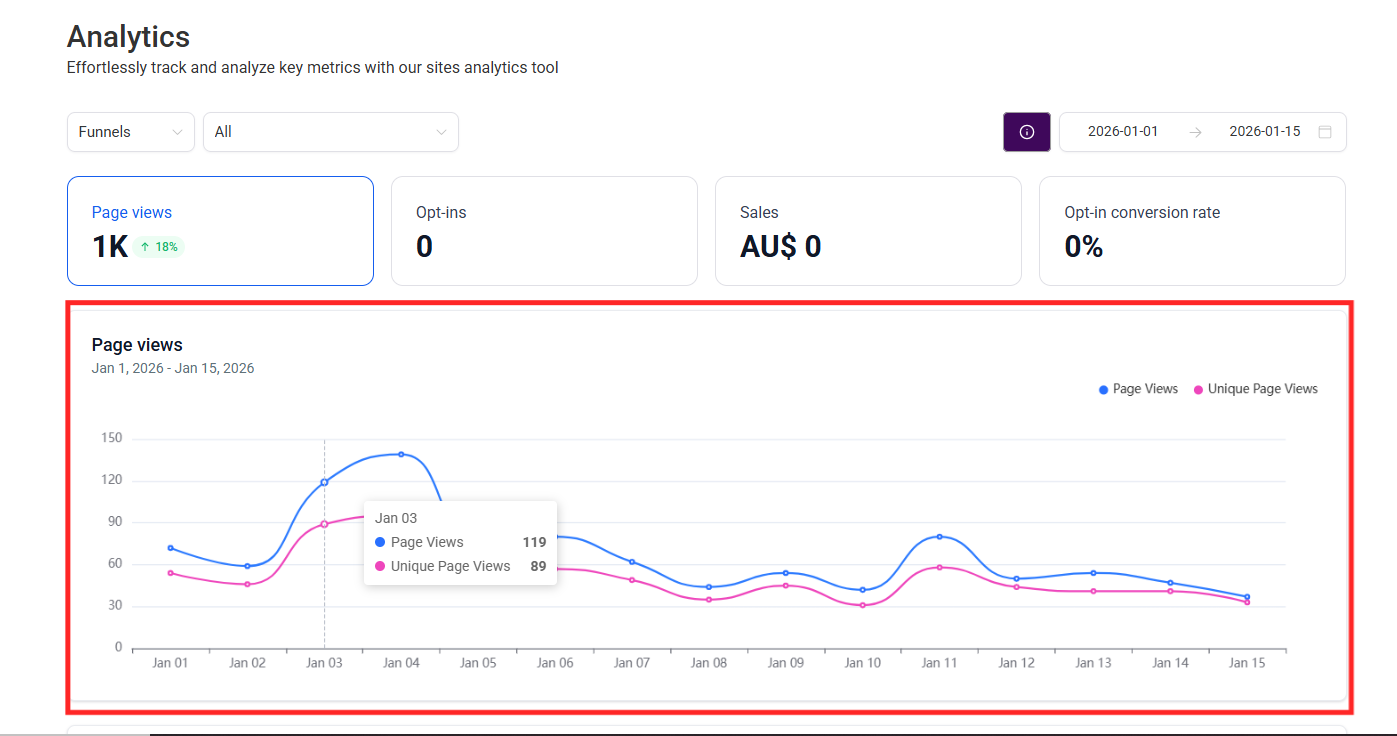
Page Views: You can see how many times your funnel/website was visited. You can also see data on unique page views.
Opt-ins: This will show you the number of conversions in your funnel/website, whether that be from submitting a form, booking an appointment, or purchasing a product.
Sales: Total revenue generated by your funnel or website.
Opt-in Conversion Rate: This will be your opt-ins divided by your unique page views.
Aside from the numbers provided for you in the metrics section, you can also see a graph view below.
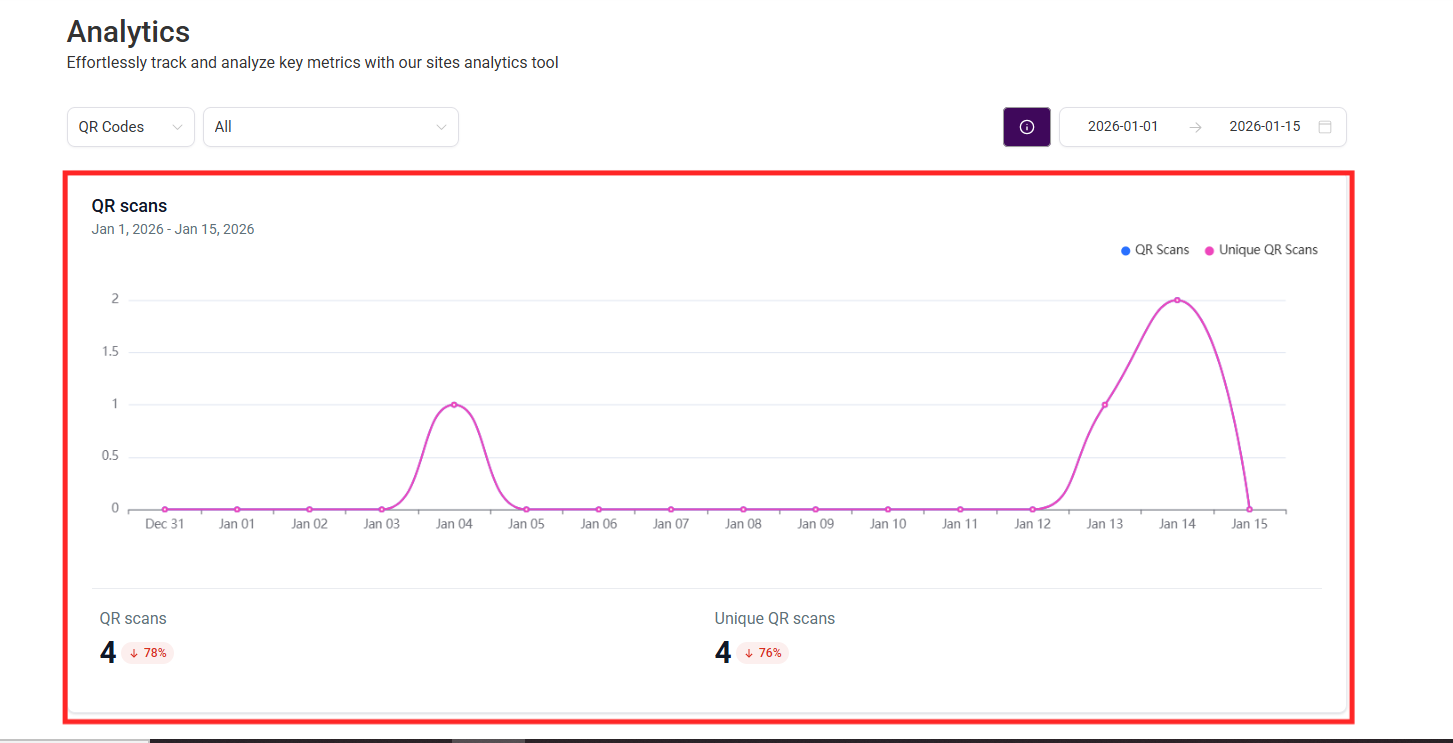
View the total number of QR code scans and the count of unique scans in the graph displayed for the selected time frame.
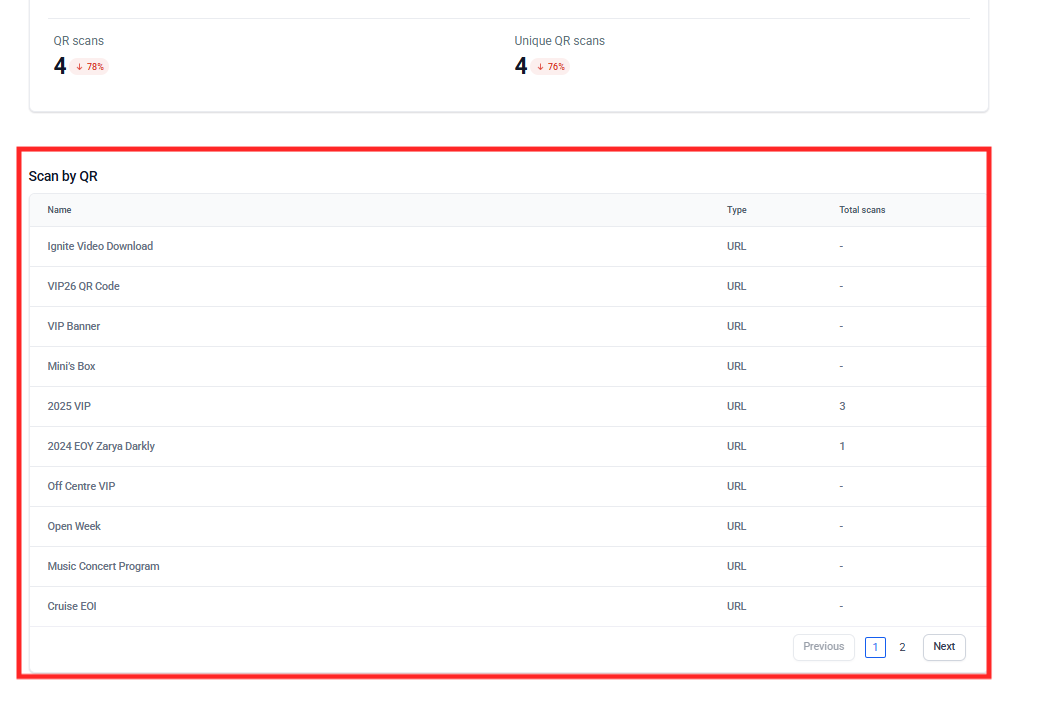
The Analytics are further summarized to display each QR code's name, its type (such as Website or Review link), and the number of times it has been scanned.
With Analytics for Sites, you can easily navigate your data. You can spot your trends and patterns quickly, without manually having to collect your data!