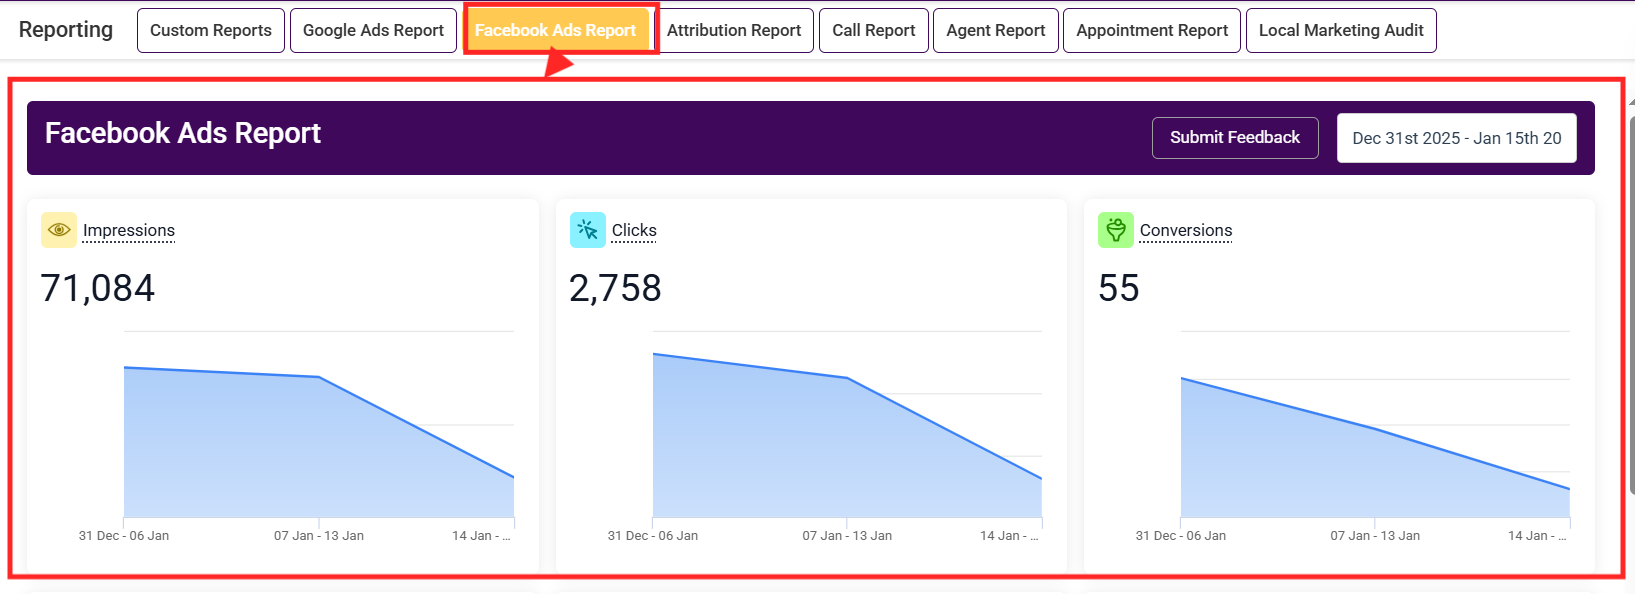
The Facebook Ads Reporting section within the Reporting tab provides a convenient way to access and analyze your campaign data without the need to log into Facebook. This feature allows you to track performance metrics such as impressions, traffic, and audience engagement.
Initially, you may see sample data displayed. To access live Facebook Ads data, you must integrate your Facebook account and ensure data syncing is enabled.
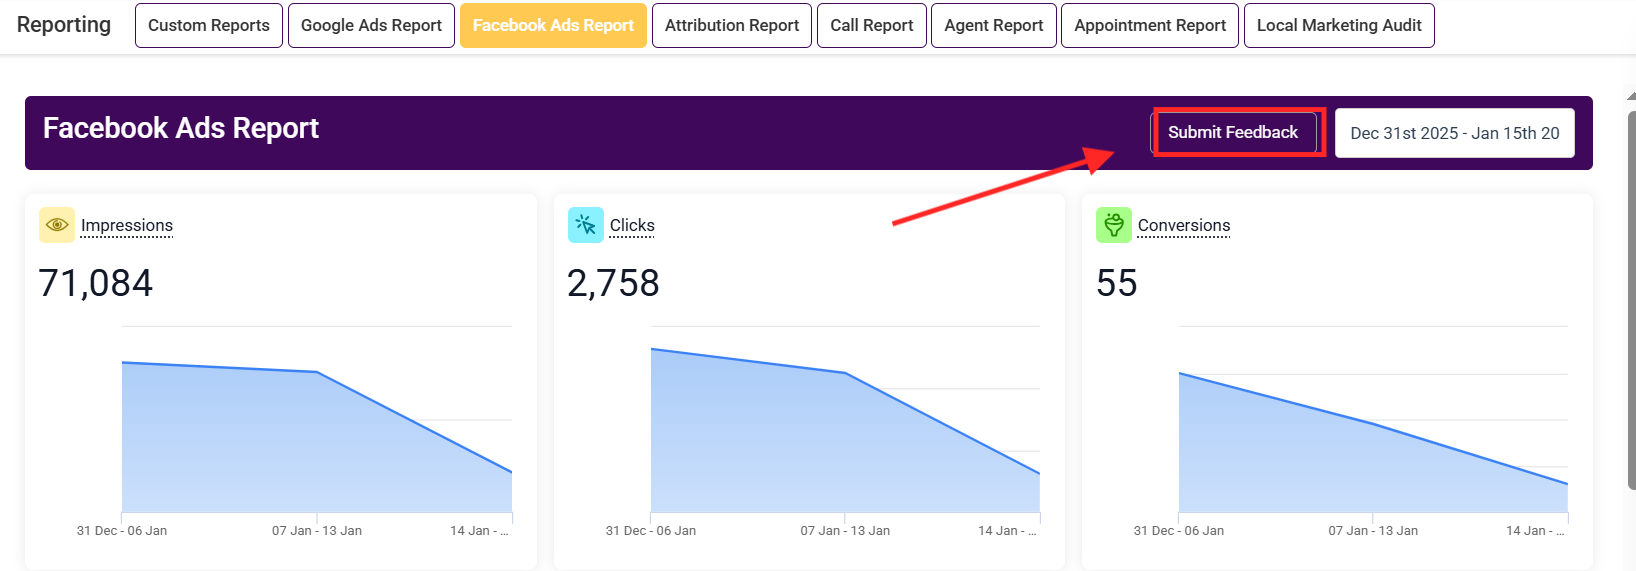
If you notice discrepancies between the dashboard and your Facebook Ads account, you can use the Submit Feedback button. This feature opens a sidebar where you can compose a message, add a subject, and attach files to describe the issue. Click the green Send Message button once you’ve filled out the form.
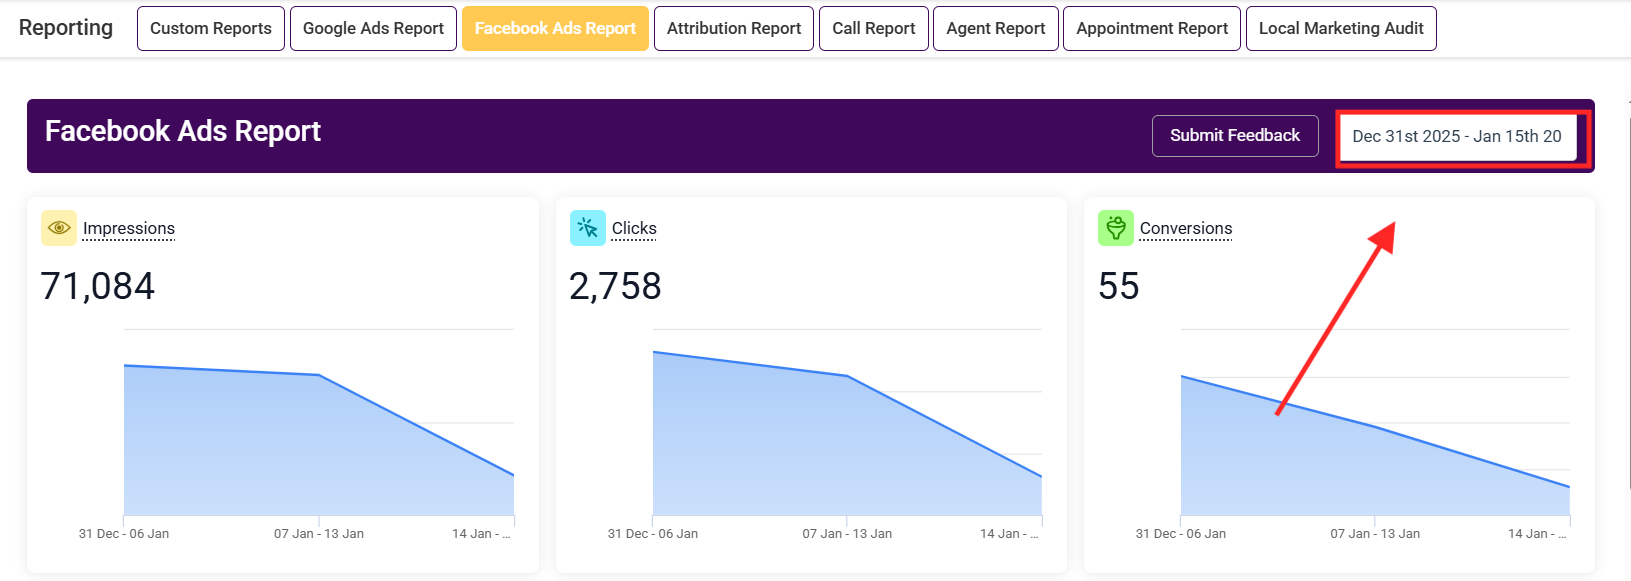
Filter your data by selecting specific date ranges to ensure the most relevant and accurate analysis. Use the calendar selector in the top-right corner, select your desired date range, and confirm with the green checkmark to update the data displayed.
The Campaign Reporting tab helps you monitor traffic, leads, and overall campaign effectiveness. Key features include:
View how many times your ads were displayed over a selected date range. This data is presented visually, allowing for daily, weekly, or monthly trend analysis.
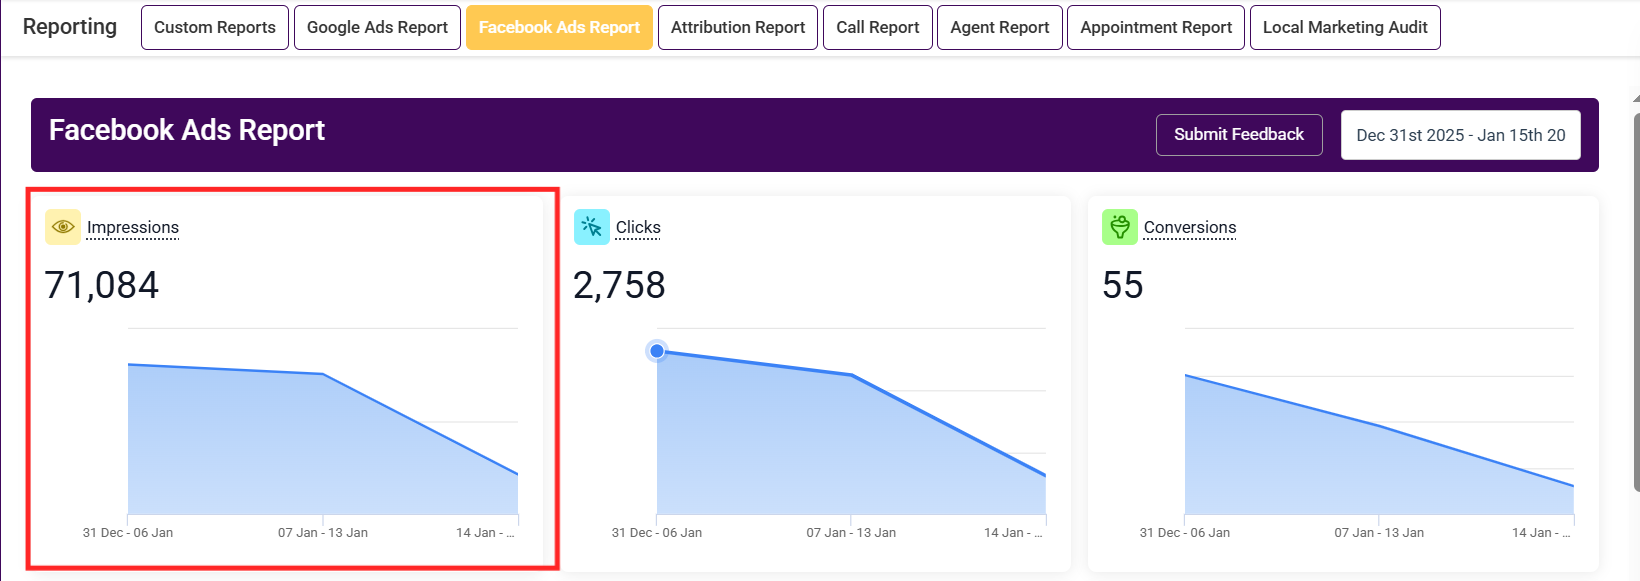
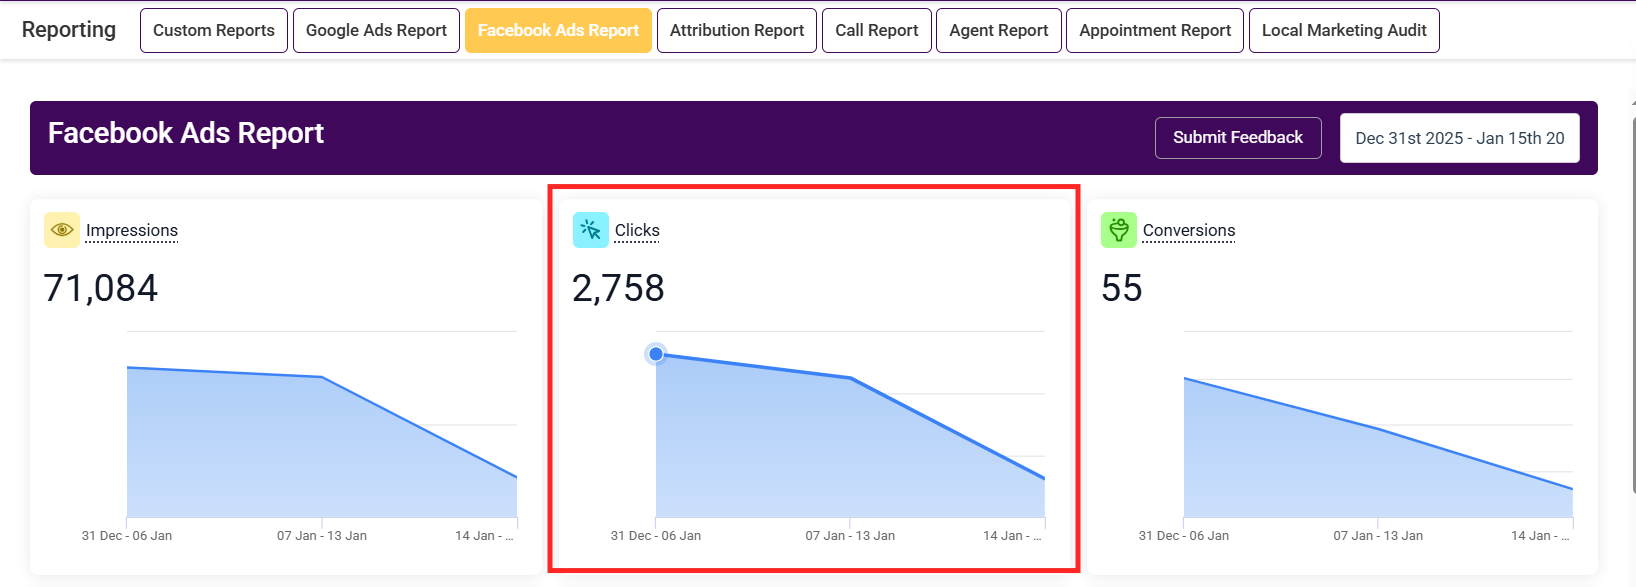
Analyze the number of users who clicked on your ad after seeing it. Clicks are displayed in a visual format based on the chosen date range.
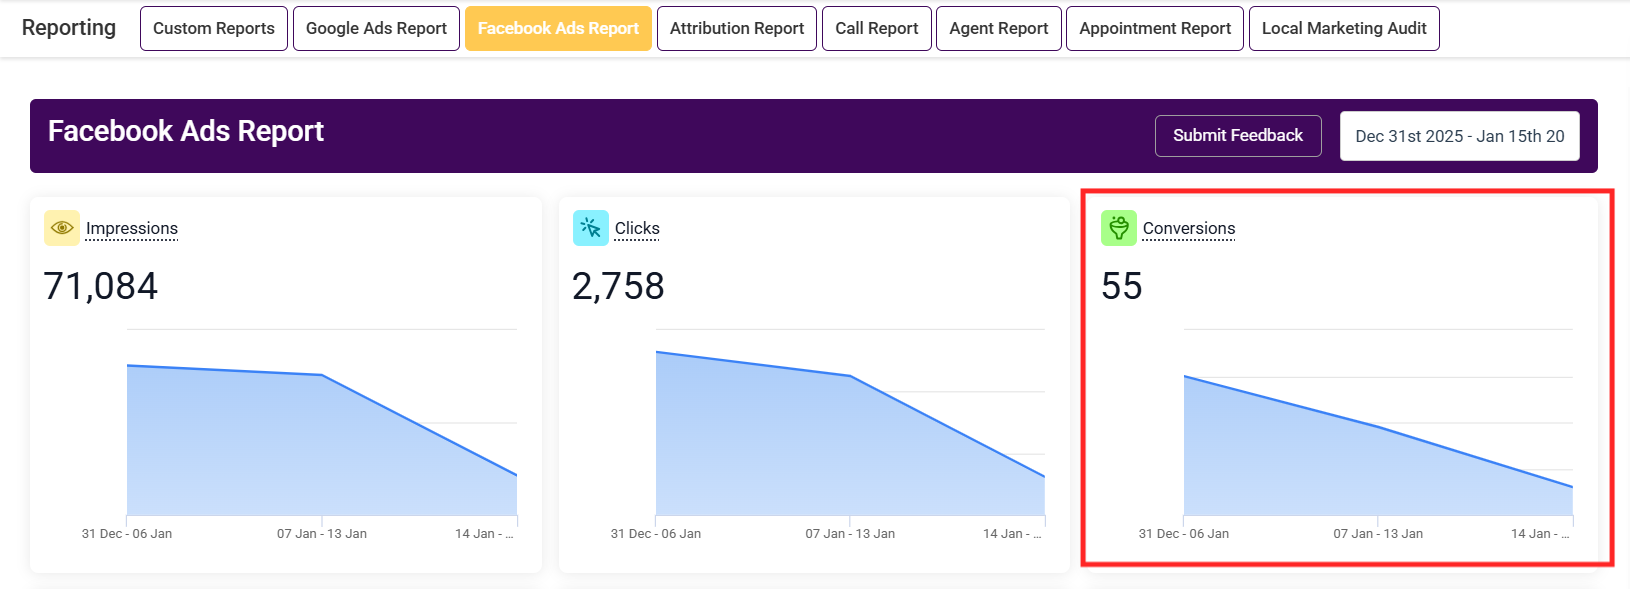
Monitor how many users performed the intended action defined by your campaign’s objective. This metric includes a visual breakdown by day, week, or month.
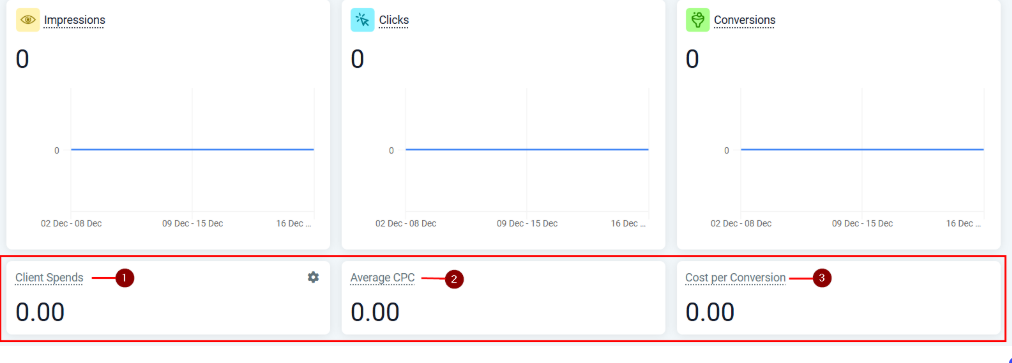
This section provides statistics for the selected date range. Metrics include:
Client Spend: Total budget spent on ads.
Average CPC: Average cost per click.
Cost Per Conversion: Average cost to generate a conversion.
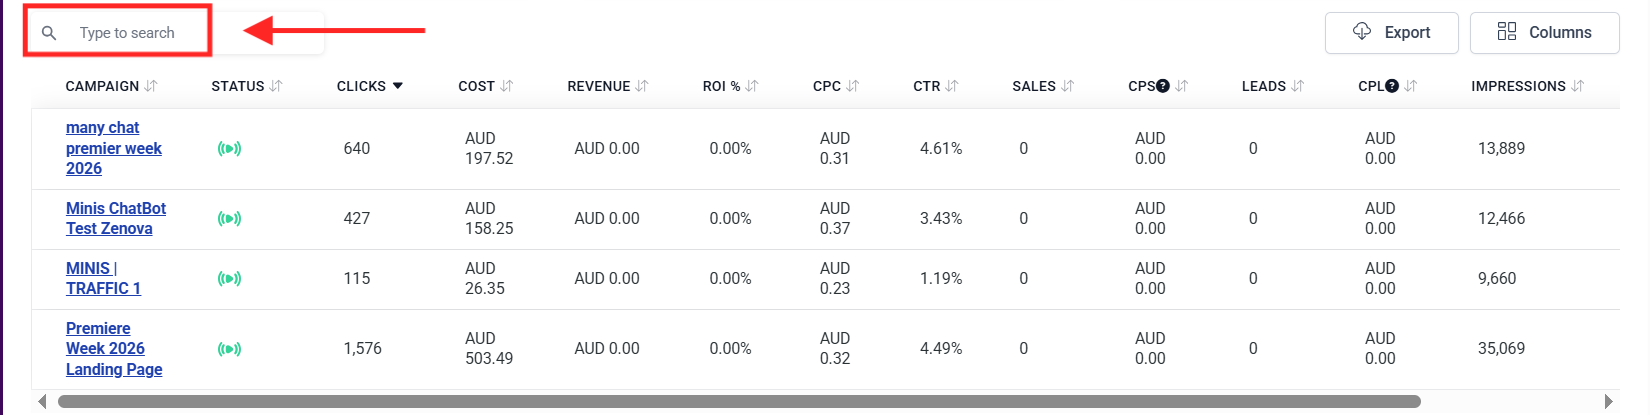
Dive deeper into individual campaign performance by viewing the details in the campaign table. Each row includes critical metrics such as Campaign name, status, clicks, cost, revenue, ROI, impressions, CPC, leads, and CPL.
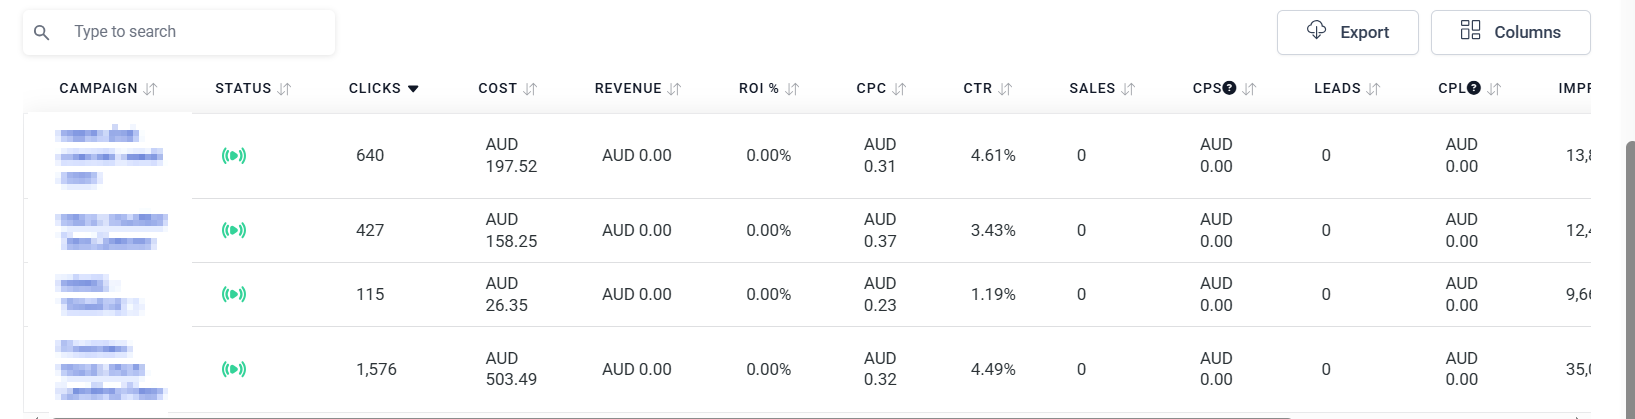
Quickly locate a specific campaign by typing its name. Campaigns that do not match the text input will disappear, refining your view.
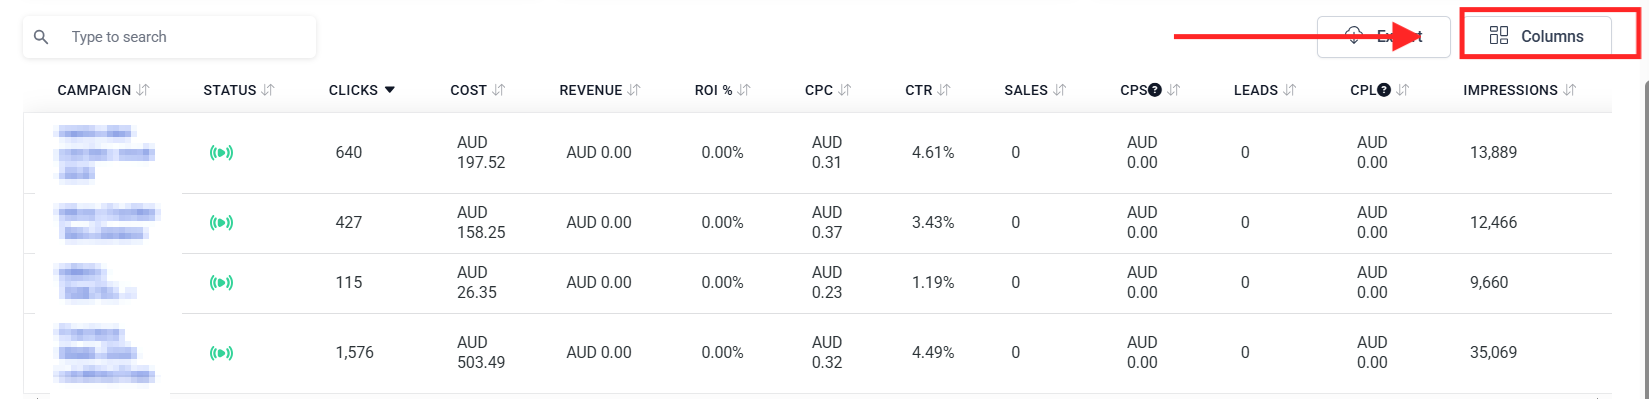
Customize the metrics displayed by enabling or disabling specific columns, ensuring your focus remains on the most relevant metrics.
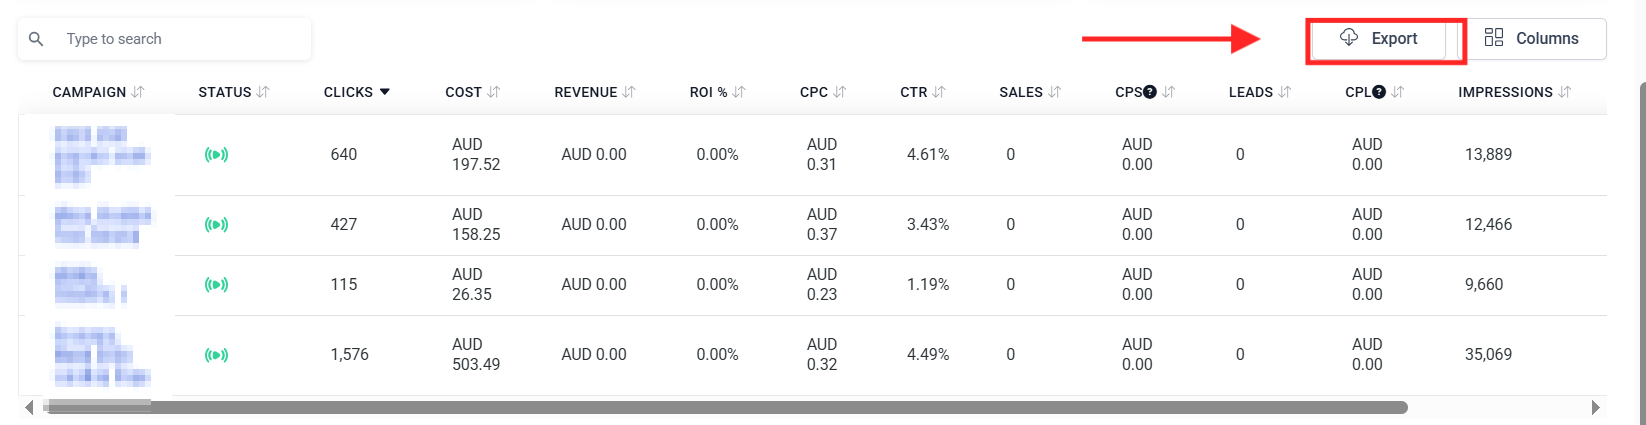
You can export the data by clicking export to a CSV file.
The Facebook Ads Reporting section within the Reporting tab provides a convenient way to access and analyze your campaign data without the need to log into Facebook. This feature allows you to track performance metrics such as impressions, traffic, and audience engagement.
Initially, you may see sample data displayed. To access live Facebook Ads data, you must integrate your Facebook account and ensure data syncing is enabled.